Using our database of over 4000 websites, we studied how on-page SEO factors correlated with winning or losing Google traffic. We found that Google’s Helpful Content system doesn’t seem to like many traditional SEO practices when pushed too far.
SEOs need to rethink “over-optimization”
Are recent Google updates now targeting SEO practices to demote informational sites that are “too optimized?”
Using metrics provided by Ahrefs (thank you, Patrick Stox!) and collecting thousands of data points across impacted sites, I conducted a 50-site case study to look for answers.
To begin with, Google’s guidance around what they call Helpful Content starts with a warning about content created specifically to attract clicks from search engines.
“Google’s automated ranking systems are designed to present helpful, reliable information that’s primarily created to benefit people, not to gain search engine rankings, in the top Search results.”
But how might Google determine if your content is “search engine-first?”
In our previous study, we examined on-page features associated with sites that saw significant traffic increases and decreases through recent Google updates. These features, such as heavy use of ads (mostly losing sites) or demonstrating first-hand experience (mostly winning sites), roughly correspond with Google statements regarding page experience and experience-based content.
This new study examines the SEO features of sites that won and lost recent Google updates and tries to identify any relationships.
Is Google Targeting Common SEO Practices?
Google tells publishers to focus on the user and not do things simply because they think Google might like them.
This sounds a lot like many common SEO practices.
In a recent interview, Google’s Elizabeth Tucker said Google needed to understand “why were we showing this (unhelpful) content in the first place.”
To begin with, it’s clear that Google has shifted the type of sites it favors. Product manufacturers and community sites have thrived where ad and affiliate informational sites have stumbled.
But this doesn’t tell the whole story.
To investigate the possible role of SEO, I fired up our database of winning and losing sites and collected thousands of data points across dozens of common SEO features.
Caveats and Disclaimers:
- While the sites included represent a good cross-section of the web, this is a very small sample size. Take all studies like these with a grain of salt.
- Importantly, these are not ranking factors, nor is anyone claiming them to be. While Google’s machine learning algorithms may associate these features with “Helpful Content” or other ranking considerations, we simply can’t say for sure.
- Importantly, correlation is not causation.
Finally, while the study examined dozens of SEO features, I’ve only included a handful of the most salient and interesting ones here. Let’s dive in.
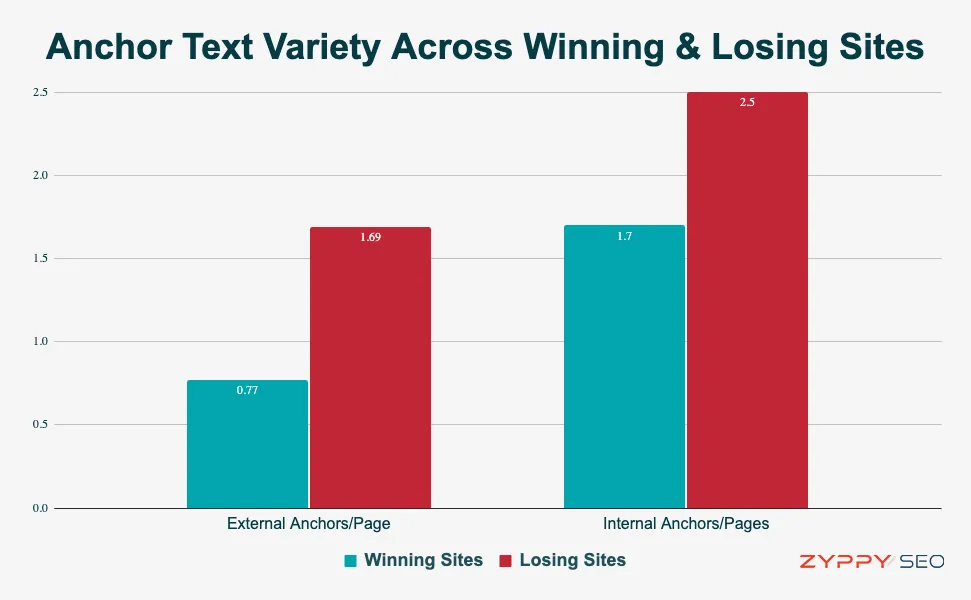
1. Anchor Text Variety
- Internal Anchors/Page | Correlation: -0.337 | Evidence: Strong
- External Anchors/Page | Correlation: -0.352 | Evidence: Strong
Honestly, this one hurts.
Losing sites were far likelier to have more anchor text variations per page than winning sites.
What do we mean by anchor text variations? Here’s an example: if you link your website’s contact page from different pages of your website using the anchor text “Contact,” “Reach Out,” and “Get In Touch,” that counts as three different anchor text variations for that URL.
In our analysis, both the number of internal and external anchor text variations per page were significantly correlated with traffic changes.
Importantly, the number of raw links was not significantly correlated – neither internally nor externally.
When you consider that evidence from both Google’s antitrust trial and the recent Google leak demonstrate how extensively Google uses anchors within its ranking system, this makes sense.
In practical terms, this means that sites practicing good internal linking with varied anchor text—long accepted as best practices—tended to do worse after these recent Google updates, at least in our dataset.
Generally, more anchor text variety is considered better. In a previous study, I wrote about the power of anchor text variety and how SEOs could use it to help boost their rankings.
Maybe SEOs overdid it? And perhaps Google paid attention.
This is likely a good time to repeat that causation isn’t correlation. We don’t know why sites with better-optimized anchors would fare worse. That said, if Google found lots of savvy SEOs aggressively using anchor text to rank higher, it’s conceivable they might look at this practice.
If true, it could mean the SEO industry needs to rethink internal linking best practices, especially for sites that have been punished by Google updates.
2. Page Updated Frequency
- Days Since Last On-page Date | Correlation: 0.455 | Evidence: Strong
Google includes a curious line in their guidance about updating dates on your content:
“Are you changing the date of pages to make them seem fresh when the content has not substantially changed?”
Many, but certainly not all, web publishers abuse their publishing dates to gain an SEO edge. Alternatively, many publishers simply want to reassure the reader that the content is fresh.
Either way, it’s very common for pages to display a recent date without substantial changes to the content.
To investigate, we took a random sample of pages from each site in our dataset and extracted the most recent “Published” or “Updated” date on the page – if one existed. We then calculated how many days old that date was.
The results, quite honestly, surprised me.

The average age of URLs on winning sites was 774 days, or a little over 2 years (e.g., 2022.)
Losing sites, on the other hand, had an average published/updated age of only 273 days – less than half the age of winning sites.
The Google leak revealed that Google stores several metrics around “lastSignificantUpdate,” so presumably, Google can tell if any updates to the page are substantial.
Another interesting fact: 35% of URLs from winning sites had no date whatsoever on the page, whereas only 4% of URLs from losing sites contained no dates.
If you frequently update the dates on your pages while only making small changes to the text, this may be a tactic to reconsider if you’ve seen a decline in traffic.
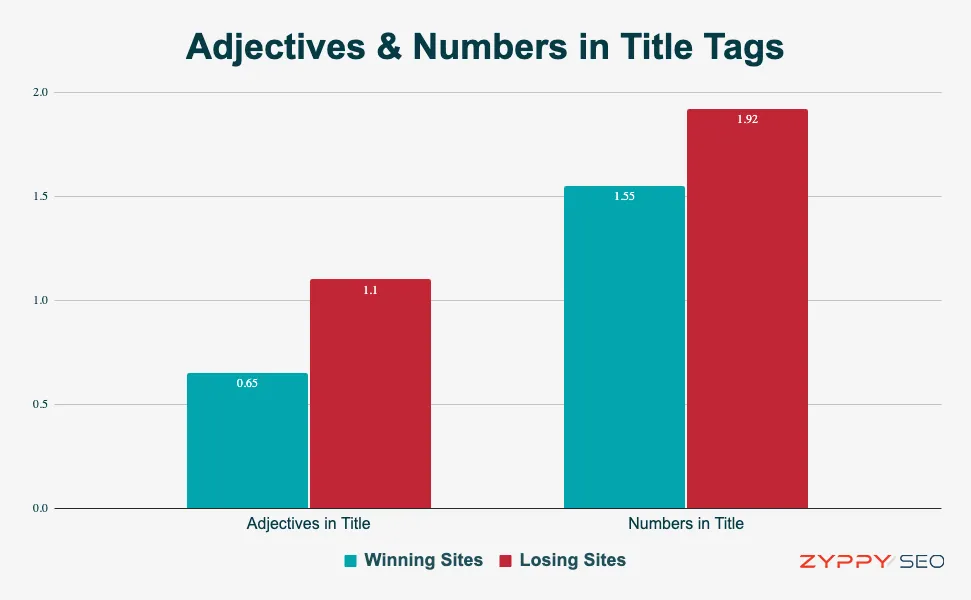
3. Highly Clickable Title Tags
- # of Numbers in Titles | Correlation: -0.297 | Evidence: Moderate
- # of Adjectives in Title | Correlation: -0.420 | Evidence: Strong
We covered these in the last study, but it’s worth noting here that sites that use catchy titles seemed to perform worse after recent Google updates.
You might call these “clickbait” titles, as they are intentionally written to attract using adjectives and numbers, often in a list-based format.
Consider the following (fictional) examples:
- 10 Breathtakingly Beautiful Spanish Destinations To Visit in 2024
- 7 Incredibly Affordable Light Bulbs to Transform Your Living Room
- 5 Highly Effective Tips for Losing That Post-Pregnancy Belly
While we examined numbers and adjectives separately, the “listicle” format seemed to be particularly associated with losing sites.
Again, correlation isn’t causation, but creating catchy titles is definitely something smart SEOs do to attract clicks.
Notably, Google includes two questions about page titles in its guidance:
- “Does the main heading or page title provide a descriptive, helpful summary of the content?”
- “Does the main heading or page title avoid exaggerating or being shocking in nature?”
While you’d be hard-pressed to label any of the above titles as “shocking,” it’s entirely reasonable that Google may favor titles that are more straightforward and descriptive than titles primarily designed to attract clicks.
With evidence from Google’s anti-trust trial and the Google document leak that clicks are used for ranking, Google may want to reduce the impact of click-based signals for certain sites.
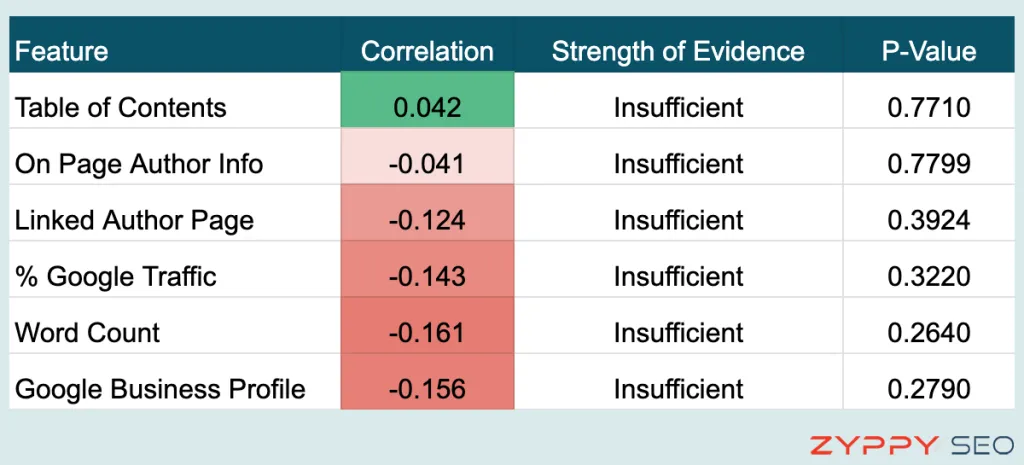
SEO Features Without Significant Correlation
While our study found strong correlations with the features mentioned above, I believe it’s equally important to highlight a number of features where we found no significant correlation to exist.
Note: Simply because we couldn’t find a statistically significant relationship, it doesn’t mean these elements aren’t important. As always, use your best judgment to do what’s best for your audience.
Reliance on Google Traffic
- % of Site Traffic From Google | Correlation: -0.143 | Evidence: Insufficient
One theory about Google’s Helpful Content Update is that it targets sites that are overly reliant on Google traffic and/or lack other traffic channels.
Using Semrush .Trends, we calculated what percentage of each site’s traffic came from Google versus how much came from other sources, e.g., social, referral, etc. Importantly, we examined traffic estimates from July 2023, before any of the recent Google updates launched. (We did this to eliminate the bias of recent declines in Google traffic for losing sites.)
In our dataset, winning sites did indeed receive less organic traffic than losing sites, 61% vs 67%.
That said, there was no clear pattern. Some winning sites received up to 95% of their traffic from Google, while some losing sites with strong social presence only received 25% of their traffic from Google.
While it’s possible this is something Google looks at, our data only showed a correlation of -0.143, with a p-value of 0.322, which is considered “insufficient” evidence.
Author Information
- Any Author Info | Correlation: -0.041 | Evidence: Insufficient
When Google talks about highlighting Expertise, Experience, Authority, and Trust (E-E-A-T) many folks in the SEO industry thought they could solve this by adding more author information to every page.
While Google’s Quality Rater Guidelines discuss the importance of finding out who created the webpage, Google mentions on-page authorship information only lightly.
In our research, we found no statistically significant relationship between author information and traffic changes from Google updates.
This doesn’t mean you shouldn’t include author information if you think it will benefit your readers.
More importantly, ensure that you demonstrate your site’s expertise through useful navigation, about pages, and relevant links and mentions from external sites.
Table of Contents
- Uses Table of Contents | Correlation: 0.042 | Evidence: Insufficient
There’s a persistent rumor that Google is more likely to hit sites that use a table of contents, so we specifically studied this element across 1500 pages of various sites.*
It’s true that we found many impacted sites containing table of contents or table of contents plugins. But we also found a near-equal number of sites that used table of contents that showed improved traffic.
In fact, table of contents were slightly positively correlated with Google traffic, but the difference was statistically insignificant.
* There’s also a rumor in SEO circles that Google’s canonical system is broken and can’t handle fragment URLs generated by table of contents systems. We’ve seen no evidence of this and find the claims unsubstantiated so far, but we’ll keep an open mind.
Word Count
- Average Article Word Count | Correlation: -0.161 | Evidence: Insufficient
Another rumor says that Google is now punishing long articles.
It’s true that in our dataset, winning sites tended to have shorter articles, averaging 2,623 words per page. Losing sites tended to have longer articles, coming in at 3,619 words per article.
That said, the data was all over the place, and many winning sites regularly publish articles exceeding 5,000 words or more.
At the end of the day, we found no statistically significant correlation between article length and traffic change.
Anecdotally, it seems that many winning URLs these days contain more focused and to-the-point articles, so maybe there’s something to this rumor.
Google Business Profiles
- Google Business Profile | Correlation: -0.156 | Evidence: Insufficient
The last feature we checked was how many of the sites had a Google Business Profile on Google Maps.
Many publishers believe that because Google seemingly wants to reward “real businesses,” setting up a Google Business Profile is a quick and easy way to accomplish this.
Unfortunately (or not), the data suggests that simply having a Google Business Profile did not offer such protection from Google updates.
In fact, losing sites were more than twice as likely to have Google Business Profiles than winning sites (24% vs 12%), though this difference was not statistically significant.
It’s quite likely Google does look for real-world business signals, but if so, they would almost certainly use far more sophisticated, less easy-to-game signals.
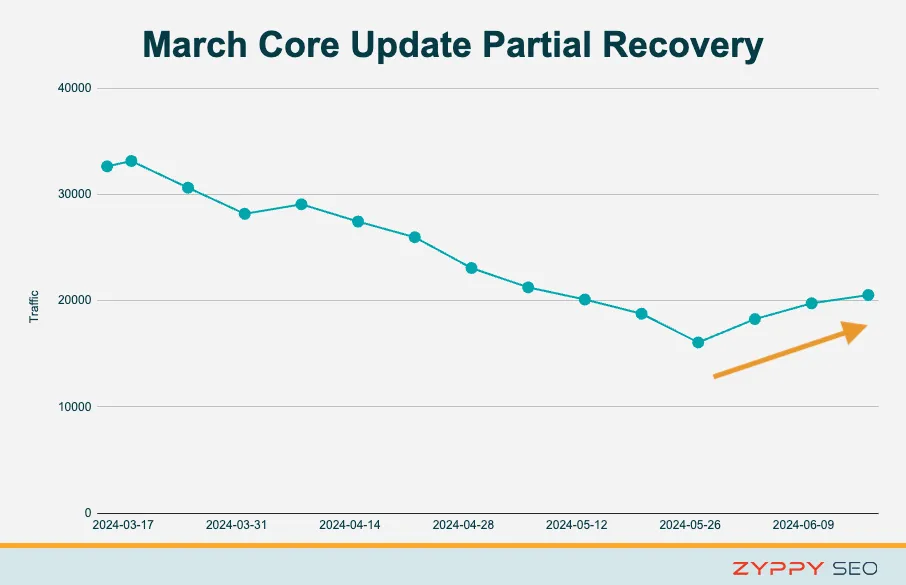
Can Your Site Recover From These Google Updates?
We are starting to see some sites show recoveries and partial recoveries, at least from Google’s March Core Update.
Two of Zyppy’s SEO clients have seen partial reversals that are still climbing. One site worked for months, making significant updates and de-optimizing. The other site simply made a few small UX tweaks (the recovery for that site isn’t as strong.)
This chart with anonymized data demonstrates what we are seeing. And we aren’t the only ones.
These updates are sneaky, but the more we learn about them, the better our chances are at recovering.
If you’ve been affected by a recent Google update and would like to develop a recovery plan based on our data, please contact us.
Have you seen anything interesting with Google’s HCU? Let us know on LinkedIn, Twitter, or Threads!
Study Methodology
A set of 50 “informational” websites were chosen for inclusion. Websites were screened for similarity in website traffic, content topics, and monetization methods. Websites were further screened based on gaining or losing traffic after major Google updates beginning in 2023. All websites were evaluated from the United States on a Chrome browser. Pearson correlation coefficients were calculated between each feature and the target variable to measure the linear relationship between them. To determine the statistical significance of the observed correlations, a t-test was performed for each feature’s correlation coefficient. The null hypothesis stated that the true correlation coefficient was zero (no correlation). P-values were computed to assess the probability of observing the correlation coefficients under the null hypothesis. A p-value threshold of 0.05 was used to determine statistical significance.